Over the last year we have received a barrage of great updates from the chaps over at Google Analytics, with everything from an interface redesign to real-time monitoring of site traffic.
However my favourite of these recent announcements has been the inclusion of five powerful new reports under the label of multi-channel funnels. These new reports are sure to be highly useful tools for advertisers and business owners alike by allowing a more detailed analysis of how they are attracting the most important traffic to their sites.
The reports are found under the Conversions section of the Standard reports, and so in order to be useful, a site must have some Goals enabled. Note that goals do not have to be e-commerce related, but are an essential part of tracking and reaching the targets of any site. For example, if you run a small business and want to know who the people are that click on your contact page, you can set that up as a goal, and then analyse who accomplishes it – who converts.

An interaction with a site is defined by the visit received from a specific channel. A channel can combine many different dimensions such as source, medium, keyword, campaign etc. The standard channels that the reports use are the following (for more info see here:)

Previously when trying to establish a picture of how effective specific marketing efforts were, Google Analytics would provide information of only the last interaction that led to a conversion. These new reports are extremely valuable as they can show us channels of visits to a site that a user makes within the 30 days before a conversion (provided cookies have not been cleared.)This is important, as a large number of visitors will browse around before eventually deciding to make a conversion.
 Under the “Multi-Channel Funnels” heading, we are provided with five reports:
Overview Report – Provides a standard graph of goal conversions over time, allowing you to choose and compare between the conversions and assisted conversions metrics. Also includes a visualizer that produces a Venn diagram of conversions and assists between up to 4 selected channels:
Assisted Conversions Report – Allows you to compare the assisted conversions and final interaction conversions metrics. Also includes a ratio of the two, helping the user to analyse which channels spread knowledge of the site, and which lead to directly to conversions.
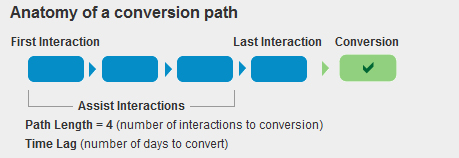
Top Conversion Paths Report – Shows in picture form, the paths that users took to convert. Also gives statistics on the numbers of people who took the specific path. For more info see here.
Time Lag – Give us information on how long users took to complete their path to conversion. Produces this in the form as below:

Path Length – Report produces a similar looking set of data to the Time Lag report, but instead of “Time Lag in Days,” shows us “Path length.”
Put together these reports give us valuable new insight into how a sites most important visitors access its most valuable content. For more information on the power of the top conversion paths report and on custom channel groupings, see our blog post here.


